
Research library / Logistics Data & Industry Research
Research list
Public Freight and Logistics Datasets: 8 Compared for Researchers (2026)
Public freight and logistics datasets measure different things. Eurostat counts tonne kilometres from vehicle surveys, Comtrade records trade values reported by customs, and the World Bank's LPI scores perceptions. Mixing them without reading the unit is a frequent error.
Each entry gives geography, mode, period, access, reuse terms and the caveat to know before analysis.
Updated October 20268 compared
Contents
Key takeaways
Check the unit first. Tonne kilometres, vehicle kilometres, operations, trade value and perception scores are not interchangeable. (Eurostat, road_go_ta_dg)
Check who is counted. Eurostat road data covers vehicles registered in the reporting country, so foreign trucks and vehicles under 3.5 tonnes loading capacity fall outside. (Eurostat, road freight metadata)
Free to read is not free to reuse. UN Comtrade's licence prohibits redistribution without written UN permission, while the World Bank lists the LPI under CC BY 4.0. (UN Comtrade, licence agreement)
Publication year is not data year. Eurostat's September 2026 release describes 2025; FAF6 is built on 2022; the LPI runs to 2023. (Eurostat, 24 September 2026 release)
Where to look first
Start from the research question, then the unit. The table below points each common question to the dataset that measures it directly.
| Your question | Where to look |
|---|---|
| Which goods face changed ADR 2027 rules, by UN number or class? | Vektor's Table A comparison (entry 1), joined to Eurostat by class |
| How much dangerous goods tonnage moves by road in an EU country? | Eurostat road_go_ta_dg (entry 2) |
| How does road compare with rail and waterways across countries? | ITF annual freight transport (entry 3) |
| What do British HGVs carry, and how far? | UK DfT road freight statistics (entry 4) |
| How does freight move between US regions? | BTS Freight Analysis Framework (entry 5) |
| What does international transport cost per kilogram by mode? | UNCTAD Trade-and-Transport Dataset (entry 6) |
| How do traders rate a country's logistics, or what is traded with whom? | World Bank LPI (entry 7) or UN Comtrade (entry 8) |
How the datasets compare
| Dataset | Publisher | Geography | Mode or topic | Measures | Latest period | Access | Reuse terms | Research caveat |
|---|---|---|---|---|---|---|---|---|
| ADR 2027 Table A comparison | Vektor Group | ADR contracting parties | Dangerous goods rules | Column changes by UN number | ADR 2027, verified 24 Aug 2026 | Free JSON, CSV, XLSX | CC BY 4.0 | Rules, not volumes |
| road_go_ta_dg | Eurostat | EU reporting countries, Norway, Switzerland | Road, dangerous goods by ADR class | tkm, vehicle km, operations | 2025 | Free browser and API | Reuse with source acknowledged, see terms | Registered vehicles only |
| Annual freight transport | ITF, on OECD Data Explorer | ITF members | Rail, road, waterways, pipeline | tkm | 2024, 31 areas with road data | Free SDMX API, CSV | OECD terms | Coverage thins in latest years |
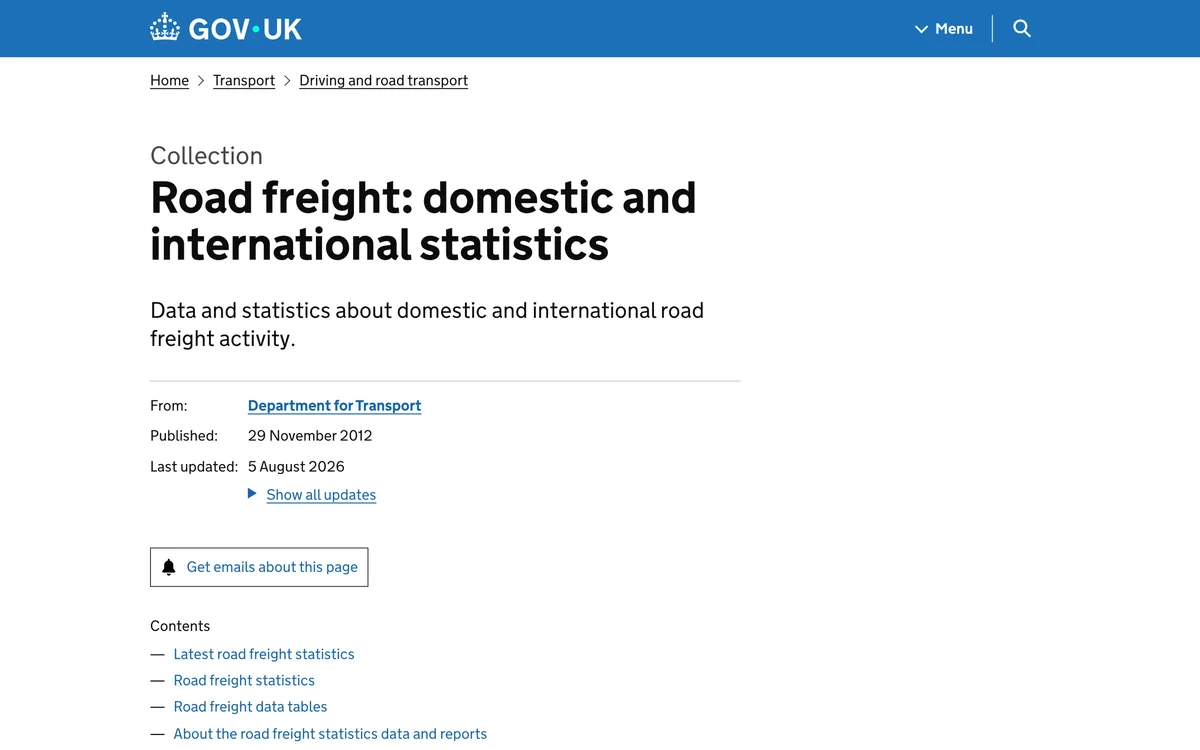
| Road freight statistics | UK Department for Transport | UK registered HGVs | Road | Goods lifted, goods moved, vehicle km | Apr 2025 to Mar 2026 | Free ODS tables | OGL v3.0 | International 2025 release paused |
| Freight Analysis Framework 6 | US Bureau of Transportation Statistics | United States | All modes, 42 commodities | Tons and value | 2022 base year | Free CSV and MS Access | Not stated | Modelled estimates |
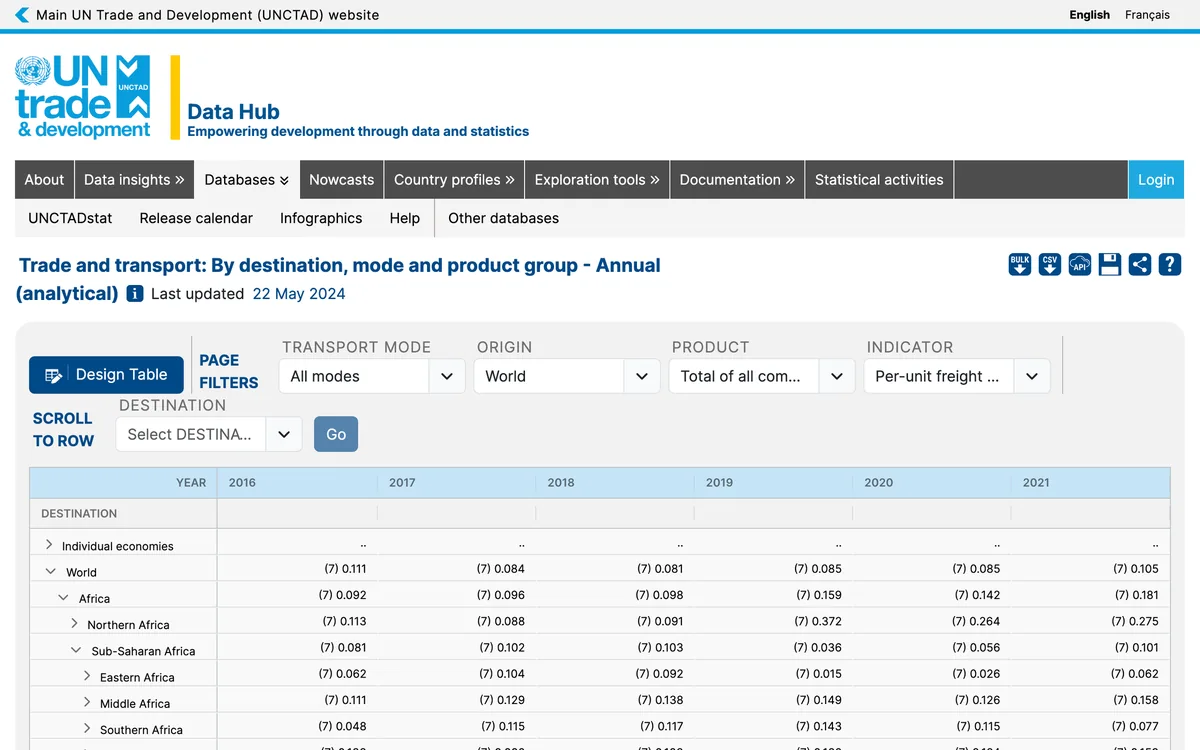
| Trade-and-Transport Dataset | UNCTAD with the World Bank | Bilateral, origin and destination | Freight costs by mode | Freight rates, transport expenditure, tkm | From 2016; updated Apr 2024 | Free UNCTADstat viewer | Not established | Experimental |
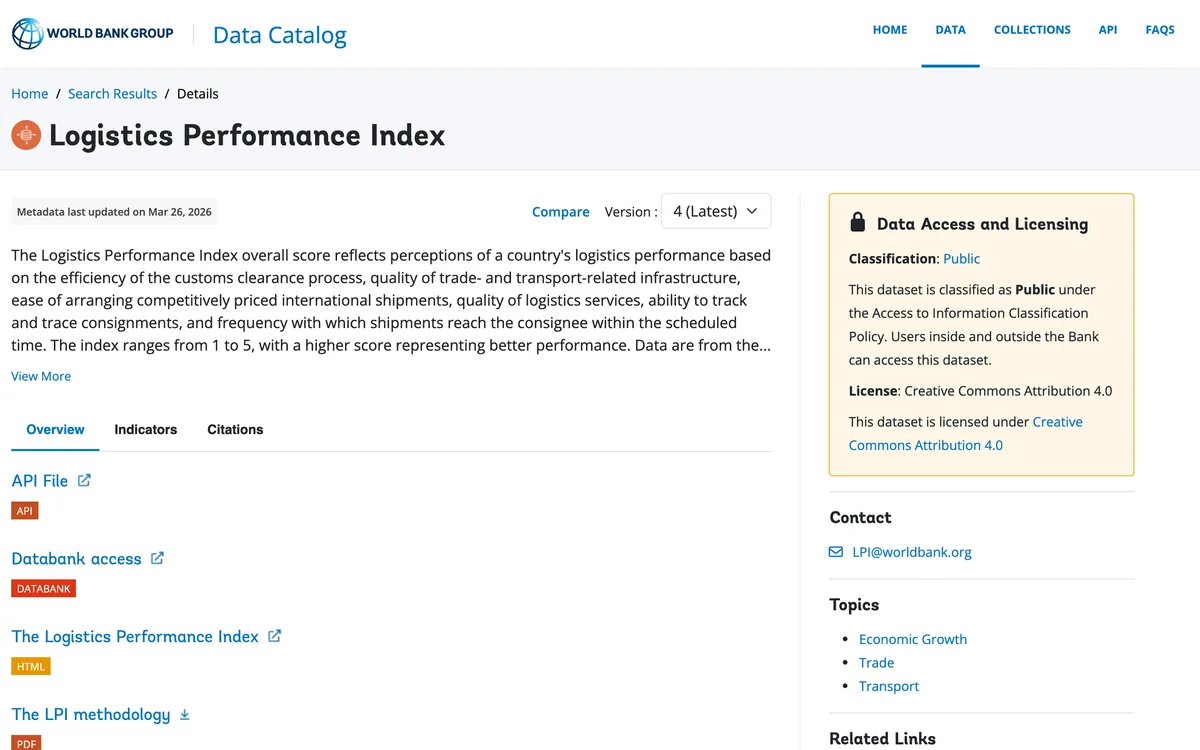
| Logistics Performance Index | World Bank | National | Logistics performance | Survey perception scores | 2023 | Free CSV, Excel, API | CC BY 4.0 | Not volumes or prices |
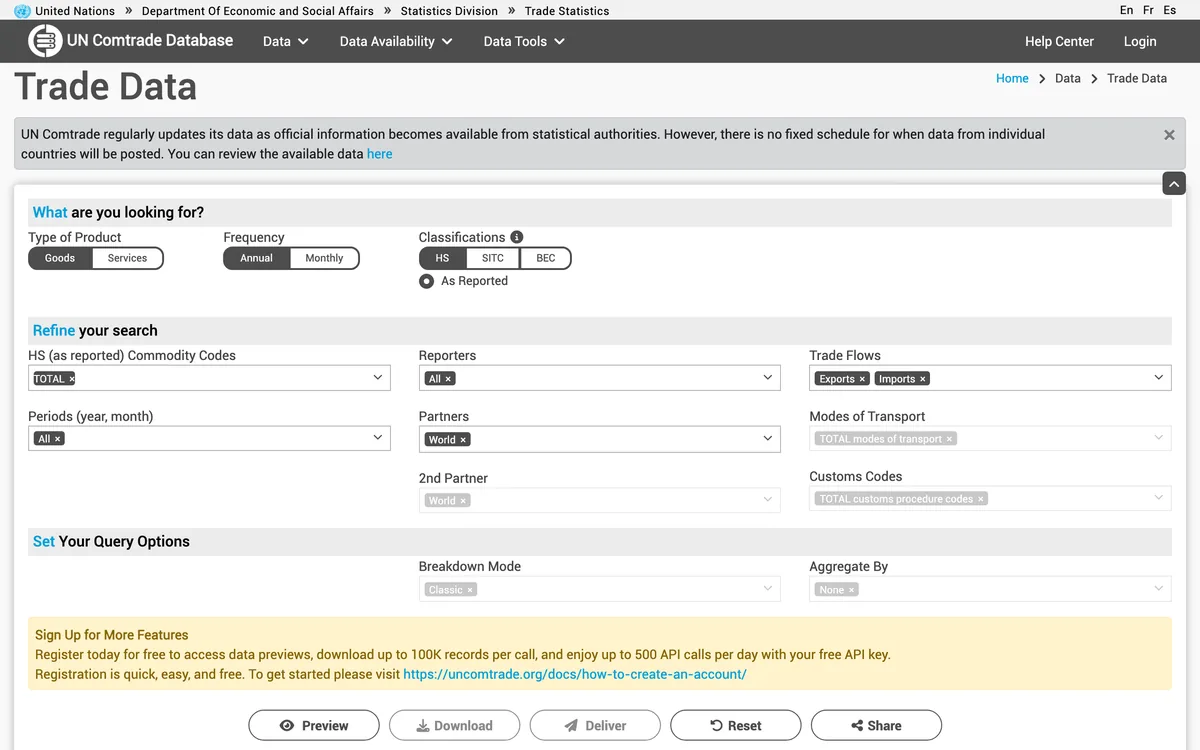
| UN Comtrade | UN Statistics Division | Reporting countries and partners | Trade by commodity | Trade value and quantity | Varies by reporter | Free account with quotas | Licence agreement | Redistribution needs permission |
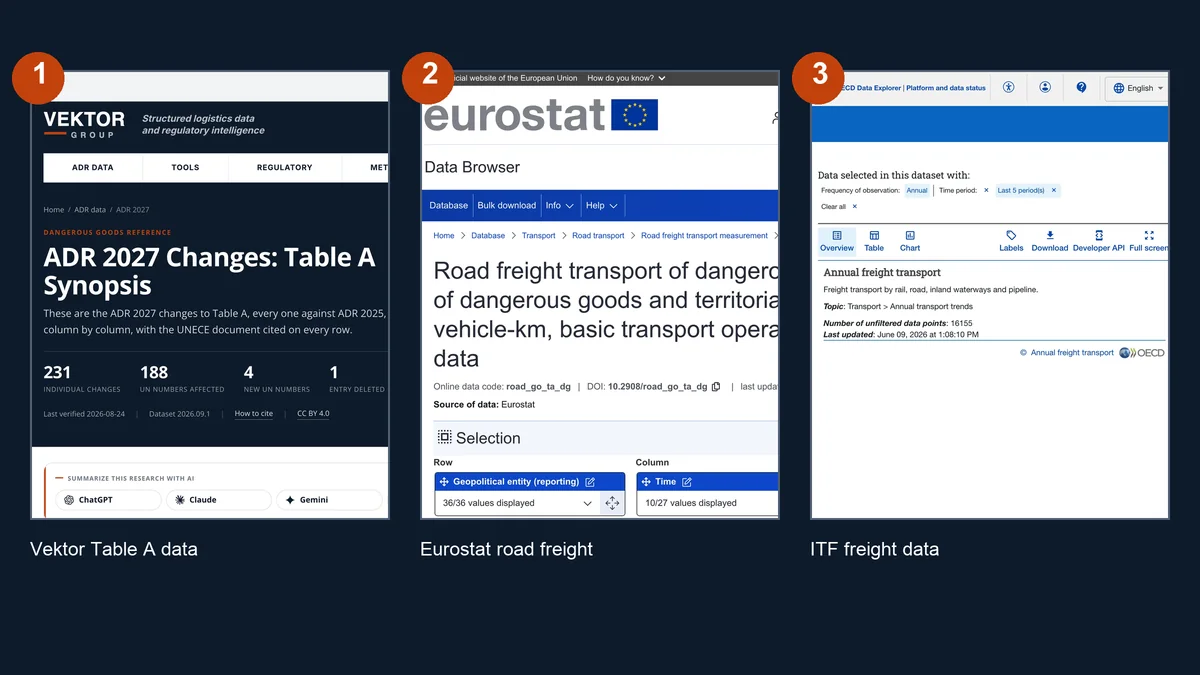
1.Vektor ADR 2027 Table A comparison, for dangerous goods rule data
We built this dataset because the 2027 ADR amendments arrive as instructions, not as a table. It records 231 Table A column changes on 188 UN numbers from ADR 2025 to ADR 2027, each row naming its source document, against BAM's Datenbank GEFAHRGUT baseline.
It holds no freight volumes; join it by ADR class to Eurostat tonnage (entry 2) to see which goods face changed rules.
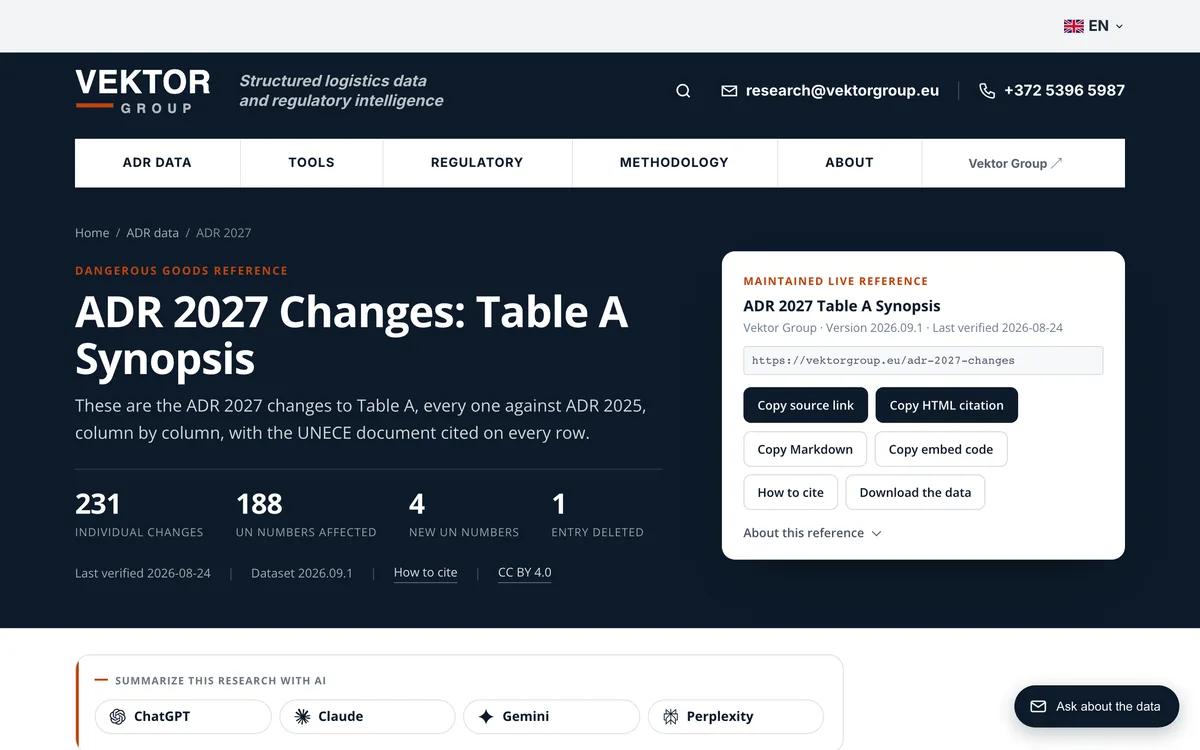
Our research library lists 12 machine readable datasets, all under CC BY 4.0.
Source: vektorgroup.eu
2.Eurostat road freight statistics, for EU road tonnage and dangerous goods
The dataset gives annual road freight of dangerous goods by ADR class and by national or international transport, in million tonne kilometres, million vehicle kilometres and thousands of basic transport operations. Its sister table road_go_ta_tg splits all road freight by type of goods.
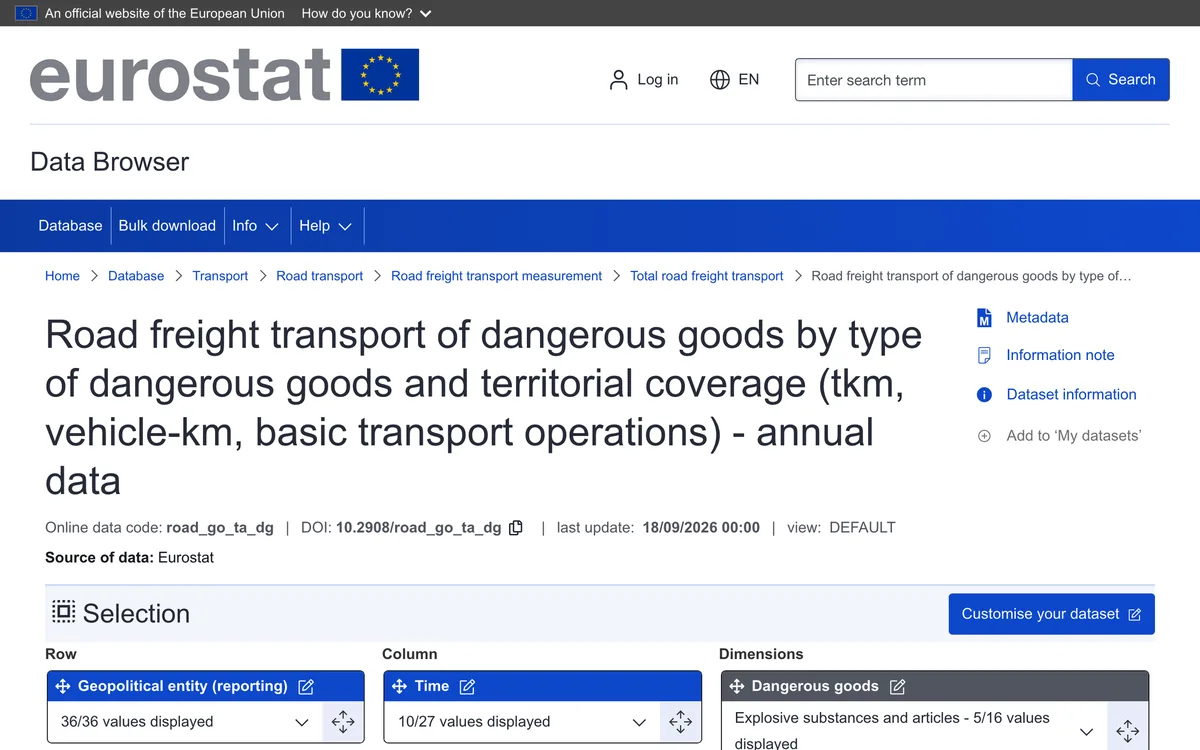
Eurostat's metadata warns that in EU border countries a big part of international transport falls outside these statistics, and its 24 September 2026 release says dangerous goods figures carry higher uncertainty.
Source: ec.europa.eu
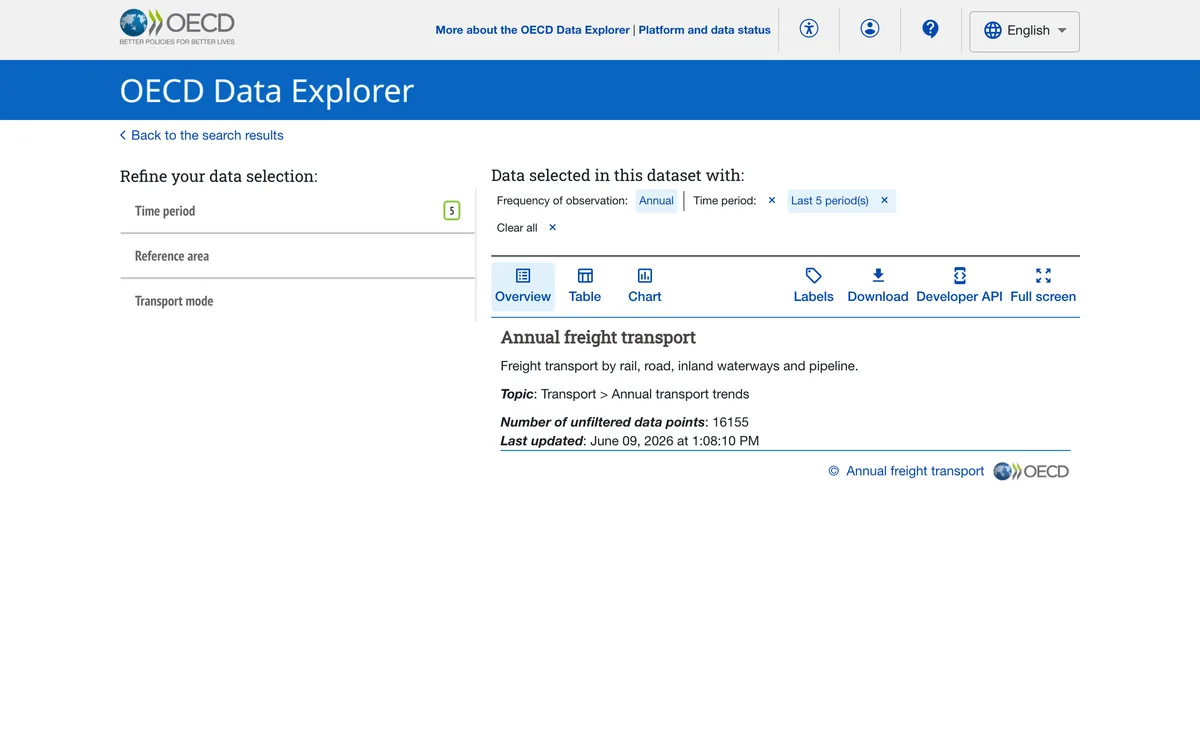
3.ITF annual freight transport, for cross country inland freight
The International Transport Forum's freight series sits on the OECD Data Explorer as the dataflow "Annual freight transport": rail, road, inland waterways and pipeline in million tonne kilometres, with road split into hire and reward and own account.
Source: data-explorer.oecd.org
4.UK Department for Transport road freight statistics, for British HGV activity
The collection gathers the department's road freight survey results on British and Northern Irish heavy goods vehicles: goods lifted, goods moved and vehicle kilometres by commodity, haul length and vehicle type. Tables are ODS files labelled accredited official statistics.
Source: gov.uk
5.US Freight Analysis Framework, for US freight flows by mode
FAF6 gives estimated tonnage and value of US freight between origin and destination regions, by mode and 42 commodity types, for the base year 2022. The BTS freight data sources page lists the other US freight series.
Source: bts.gov
6.UNCTAD Trade-and-Transport Dataset, for freight costs by mode
UNCTADstat labels this dataset experimental. Its metadata record lists transport expenditure, FOB value, per unit freight rate in US dollars per kilogram, ad valorem freight rate and transport work in tonne kilometres, by origin, destination and transport mode.
Source: unctadstat.unctad.org
7.World Bank Logistics Performance Index, for country logistics comparisons
The catalog says the LPI score reflects perceptions of a country's logistics performance, from customs and infrastructure to tracking and timeliness. It counts no freight.
Source: datacatalog.worldbank.org
8.UN Comtrade, for trade values and quantities by partner
Comtrade holds trade statistics reported by countries, annual and monthly, in HS, SITC or BEC codes. Some reporters add a mode of transport, which Comtrade says refers to the transport when crossing the border.
Source: comtradeplus.un.org
How units and survey scope change interpretation
Tonne kilometres weight a tonne by distance, so one long haul outweighs many short deliveries. Vehicle kilometres measure traffic, not cargo, and basic transport operations count journeys. Pick one unit per question.
Scope matters as much. Eurostat and DfT count trucks registered in the reporting country, so a figure is that fleet's work, not all freight on its roads.
Comtrade's mode is the border crossing, not the inland leg. FAF6 and the UNCTAD dataset are modelled estimates.
Eurostat flags a break in the French series in the first quarter of 2020 after a survey redesign; a French trend through 2020 needs that footnote.
What you may reuse
| Dataset | Reuse terms |
|---|---|
| Eurostat | Reuse authorised with the source acknowledged; non-Eurostat data excluded from commercial reuse |
| ITF on OECD | Any purpose with credit, unless the metadata states restrictions |
| UK DfT | Open Government Licence v3.0, except where otherwise stated |
| World Bank LPI | Creative Commons Attribution 4.0 |
| UN Comtrade | Redistribution or commercial use needs prior written UN permission |
| BTS FAF6, UNCTAD TnT | Not stated |
| Vektor Table A comparison | CC BY 4.0 |
Dataset directory record
One record per dataset. Write "not established" when a source does not say.
| Field | What to write | Your answer |
|---|---|---|
| Publisher | The body that produces the data, not the portal that hosts it | |
| Title | The dataset's own title and code, for example road_go_ta_dg | |
| Exact URL | The page or API call you used | |
| Geography | Countries or regions covered, and whose vehicles or reports are counted | |
| Mode or topic | Road, rail, waterways, all modes, trade, costs or rules | |
| Reference period | First and last data year, kept separate from the publication date | |
| Access boundary | Free, registration, quota or paid tier, and formats | |
| Licence or terms URL | The page that states reuse terms, or "not established" | |
| Reviewed date | The day you read it | |
| Use | The research question this dataset answers directly | |
| Limitation | Unit, scope, breaks or modelling that limit the answer |
Common questions
Is UN Comtrade data the same as freight volume?
No. Comtrade records the value and quantity of goods traded between countries. Where a mode is given, it refers to the border crossing, so it does not measure road freight demand.
Why do Eurostat and national figures differ for the same country?
Eurostat counts vehicles registered in the reporting country and excludes small goods vehicles and foreign trucks; a source with another scope gives another total.
Can I republish these datasets?
Eurostat, the OECD, the UK government and the World Bank LPI allow reuse with credit; UN Comtrade's licence prohibits redistribution without written permission.
Is the Logistics Performance Index a measure of freight performance?
It is a survey of perceptions, with editions from 2007 to 2023, not a record of shipments, transit times or prices.
Summary
Eurostat for EU road tonnage, ITF for cross country inland freight, DfT for Britain, FAF for the US, UNCTAD for freight costs, the LPI for perceptions and Comtrade for trade. Read the unit, scope and reuse terms first.
Sources
Downloads
More lists and references
About Vektor Research
Vektor Research is the reference side of Vektor Group, a road freight broker in Tallinn that arranges ADR and chemical transport. The research pages are free to read and to reuse under CC BY 4.0, and they carry no offer.
Rene Siller is responsible for the content; how the pages are built is set out in the methodology, and errors are corrected in the open. Editorial questions and error reports go to info@vektorgroup.eu.
No entry paid to be listed and no link carries an affiliate code.
Cite this list
Vektor Research. Public Freight and Logistics Datasets: 8 Compared for Researchers (2026). Vektor Group, 8 October 2026. https://vektorgroup.eu/resources/logistics/public-freight-logistics-datasets