
Research library / Logistics Data & Industry Research
Research list
Road Freight Market Reports: 7 Compared by What Each Measures (2026)
Road freight market reports measure different things. A rate index, a capacity ratio, a cost model, a sentiment balance and a tonne count can move in one quarter for different reasons; swapping one for another makes a headline wrong.
Below, each is set out by what it measures, how, how often, what history you can reach and what reuse it allows.
Updated October 20267 compared
Contents
Key takeaways
Rates The Ti, Upply and IRU benchmark is one joint quarterly rate index report, not three measurements. (IRU, Q2 2026 benchmark page)
Capacity TIMOCOM's barometer is a ratio of freight offers to vehicle space offers inside its own exchange, not a price. (TIMOCOM, transport barometer page)
Costs Spain's transport ministry models costs for 20 vehicle types and publishes a separate price index. (Spain's transport ministry, road freight observatories)
Sentiment The BVL and ifo Logistik-Indikator is a German survey balance, not an amount. (BVL and ifo, method note)
Volumes Eurostat and the DfT count activity from vehicle surveys and allow reuse with acknowledgement. (Eurostat, release of 24 September 2026)
Where to look first
Pick the measure first, then the report: a rate, a cost, a capacity signal, a mood or a count.
| Your question | Where to look |
|---|---|
| Where does Vektor keep its market context? | Our market intelligence page (entry 1) |
| How have European contract and spot rates moved? | The Ti, Upply and IRU benchmark (entry 2) |
| Is there more freight than trucks on a route? | TIMOCOM's transport barometer (entry 3) |
| What does it cost to run a truck or a chemical tanker? | Spain's road freight observatories (entry 4) |
| Do German logistics firms expect improvement? | BVL and ifo Logistik-Indikator (entry 5) |
| How much EU road freight was dangerous goods? | Eurostat road freight statistics (entry 6) |
| What do UK lorries carry at home and abroad? | DfT road freight statistics (entry 7) |
What each series measures
| Indicator or report | What it measures | Geography and sample | Frequency | History and access | Reproduction rights | What it cannot show |
|---|---|---|---|---|---|---|
| Vektor market intelligence page | Outside figures it names | Lanes we broker; no own sample | No set cadence; last review 18 July 2026 | Free; no series | Not published | A Vektor measured rate or index |
| Ti, Upply and IRU benchmark | Contract and spot rate indices | 36 international lanes, per Ti | Quarterly | Since 2020; PDF after a form | All rights reserved, IRU page | A lane price, or ADR rates |
| TIMOCOM transport barometer | Freight offers to vehicle space offers | 46 countries; TIMOCOM exchange users | Every 15 minutes; quarterly reports | Annual overview on the page | Not published | A price, or freight outside TIMOCOM |
| Spain's road freight observatories | Operating cost; price per loaded km; activity | Spanish HGVs; 1,000 vehicles a week | Quarterly | Free PDFs back to 2018; price index based at Q1 1999 | Open data licence exists; not stated on these pages | Non Spanish carriers |
| BVL and ifo Logistik-Indikator | Business climate balance | Germany; over 4,000 answers | Monthly; quarterly commentary | History for members | Not published | Rates, costs or volumes |
| Eurostat road freight statistics | Tonnes and tonne km by goods type | EU vehicle surveys; Malta excluded | Annual | Free datasets | Reuse authorised with source acknowledged | Prices, costs or the current quarter |
| DfT road freight statistics | Activity of UK HGVs | UK registered HGVs, DfT surveys | Annual and rolling 12 month releases | Free reports and tables | Open Government Licence v3.0 | Non UK vehicles; prices |
1.Vektor market intelligence page, for the context we work from
Our market intelligence page collects the outside figures we use on the lanes we broker. It shows a driver shortage share and the Dutch truck toll average under a note naming the Ti, Upply and IRU benchmark, national toll authorities and an IRU driver survey, with Q1 2026 data reviewed on 18 July 2026. It also links our cost and rate calculators and the free ADR reference set.
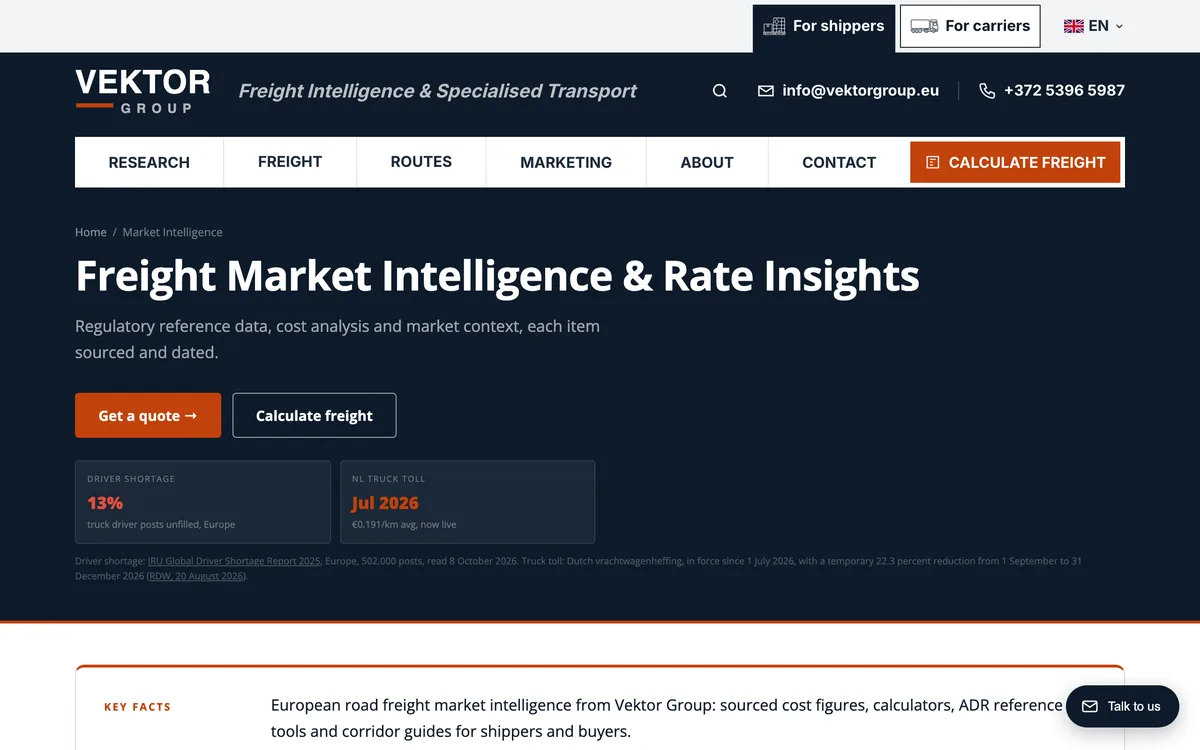
The driver cost guide it links is a calculator, not a report: it works out driver cost from your own numbers.
Source: vektorgroup.eu
2.Ti, Upply and IRU benchmark, for contract and spot rate trends
One quarterly report from three publishers: the analyst Ti, the freight platform Upply and the road transport association IRU. For Q2 2026, IRU's landing page states contract rates of 148 index points and spot rates of 146.8, both rising on cost rather than demand.
Ti's page lists weekly rate development across 36 international European lanes and the effect of tolls, driver shortages and fuel.
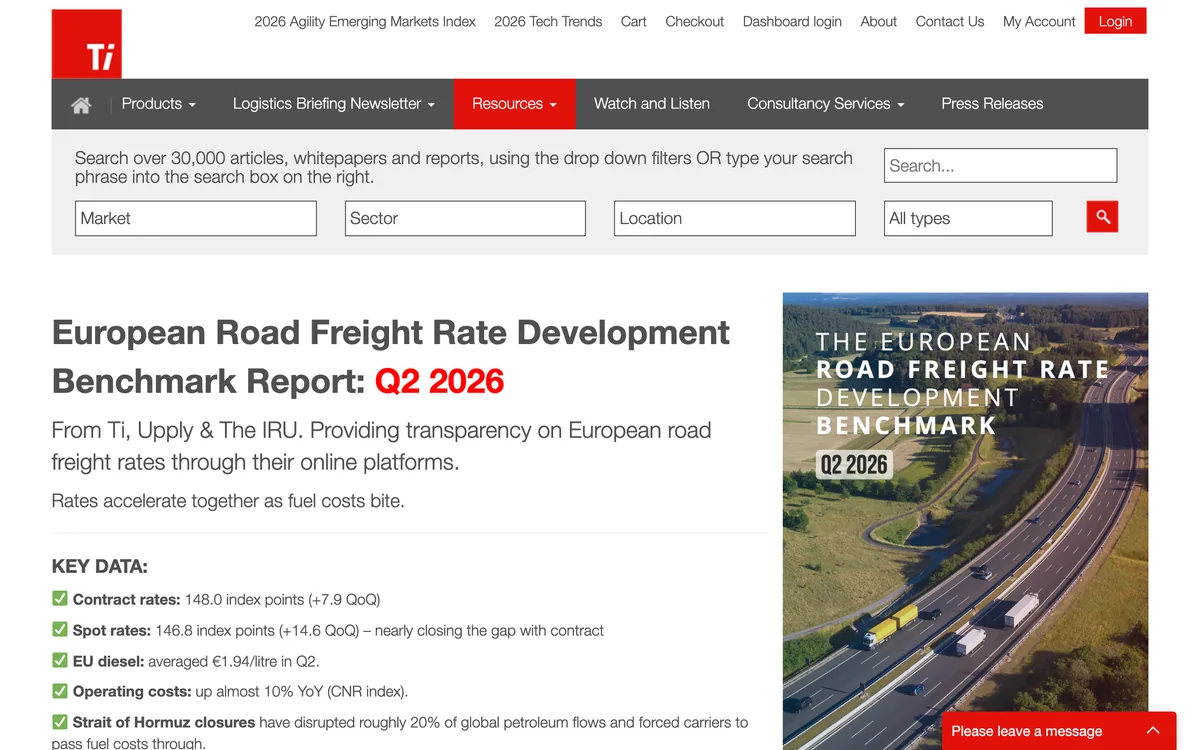
The cost line on Ti's page, operating costs up almost 10% year on year, comes from the CNR index: a cost measure quoted inside a rate report.
Source: ti-insight.com
3.TIMOCOM transport barometer, for a capacity signal by route
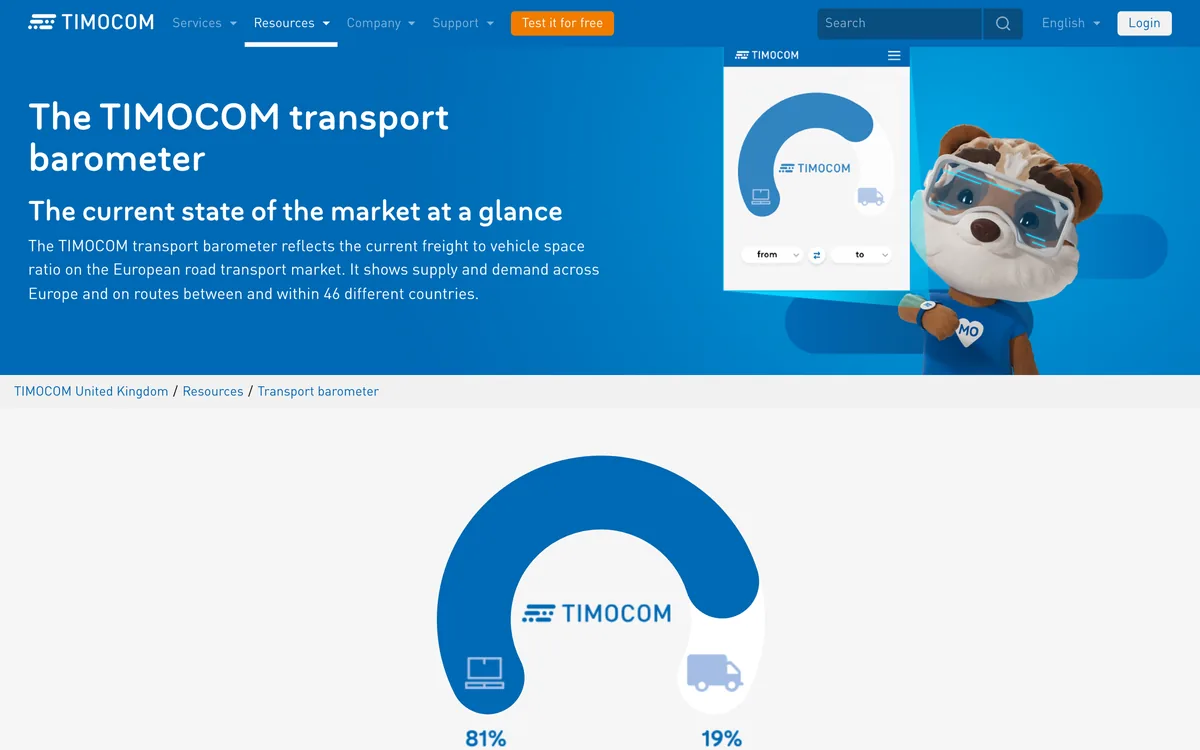
TIMOCOM runs a freight exchange, and its barometer shows the ratio of freight offers to vehicle space offers posted there, across Europe and on routes between and within 46 countries. The page says the data updates every 15 minutes and that quarterly reports add average freight offer rates.
Source: timocom.co.uk
4.Spain's road freight observatories, for costs and prices kept apart
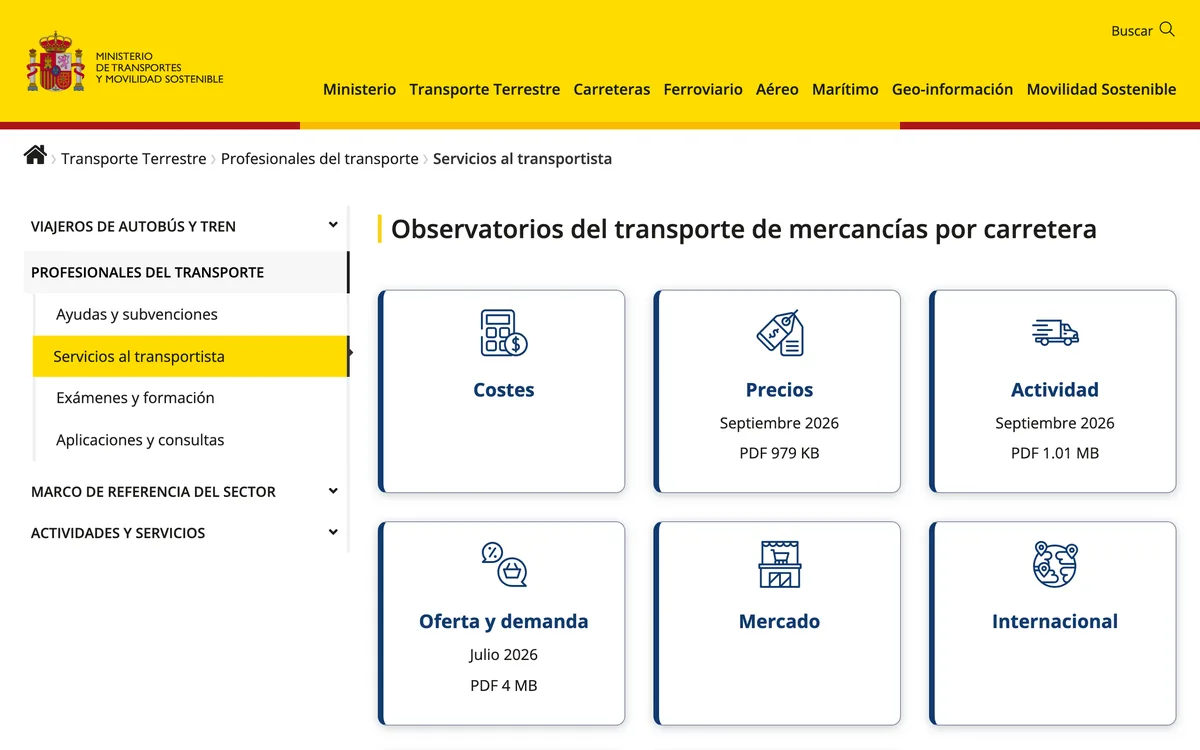
Spain's transport ministry publishes separate observatories for costs, prices and activity. The cost observatory models the running cost of 20 vehicle types, chemical and LPG tankers among them, on a cost structure agreed with hauliers' and shippers' bodies.
The price observatory takes price per loaded kilometre from a survey of 1,000 vehicles a week, indexed to 100 in Q1 1999. The September 2026 edition runs to Q2 2026 and sets prices beside costs.
Source: transportes.gob.es
5.BVL and ifo Logistik-Indikator, for business sentiment in German logistics
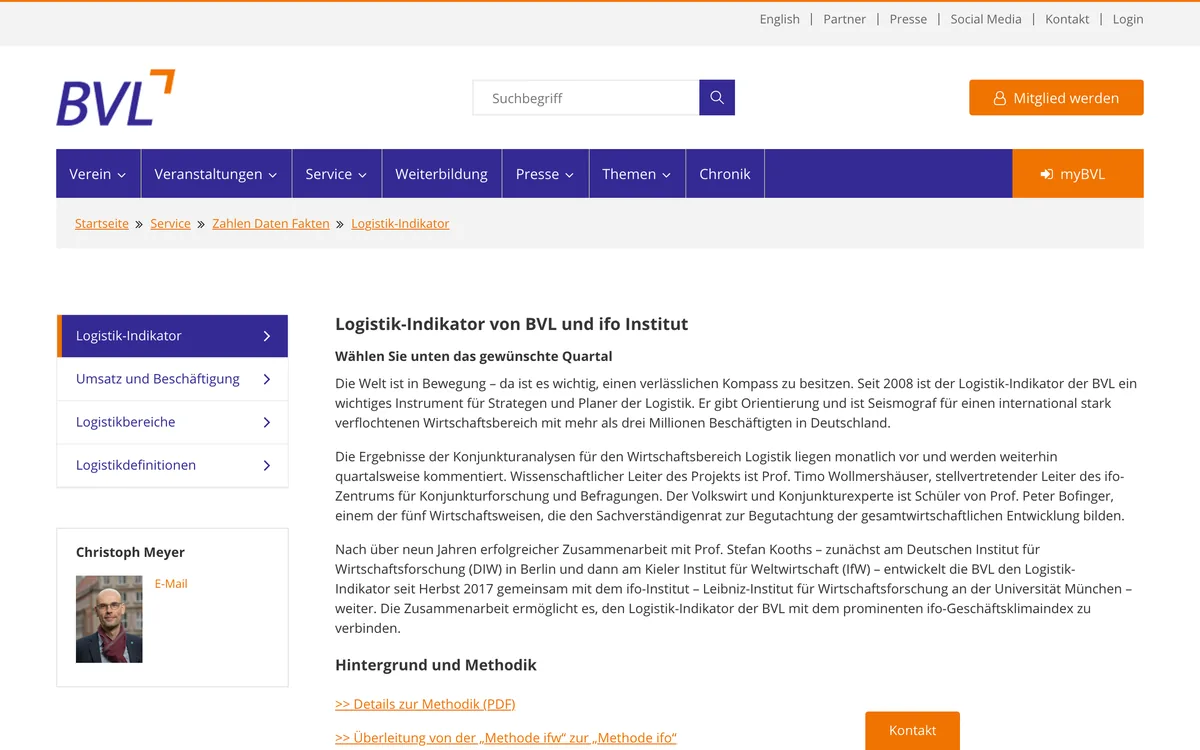
The German logistics association BVL and the ifo Institute publish a business climate indicator for logistics. Its method note says it draws on more than 4,000 answers from logistics providers, 60% freight transport and 40% forwarding and logistics, and from manufacturers and traders as users, weighted equally. The climate is the mean of the balances for the current situation and six month expectations; for Q3 2026 BVL states the situation rose from 83.0 to 85.8.
Source: bvl.de
6.Eurostat road freight statistics, for EU volumes by goods type
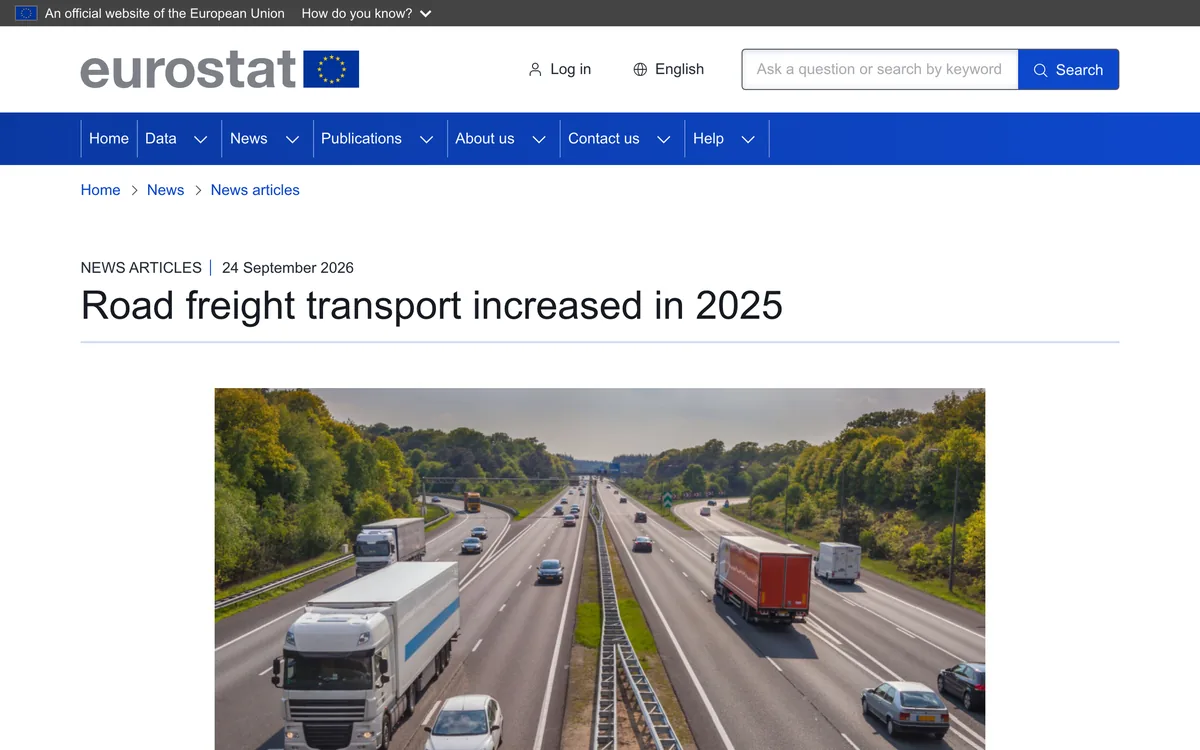
Eurostat's release of 24 September 2026 puts 2025 EU road freight at 13.29 billion tonnes, up 1.8% on 2024, and dangerous goods at 4.0% of tonne kilometres, from 9.8% in Finland to 0.7% in Lithuania.
Source: ec.europa.eu
7.DfT road freight statistics, for what UK lorries carry
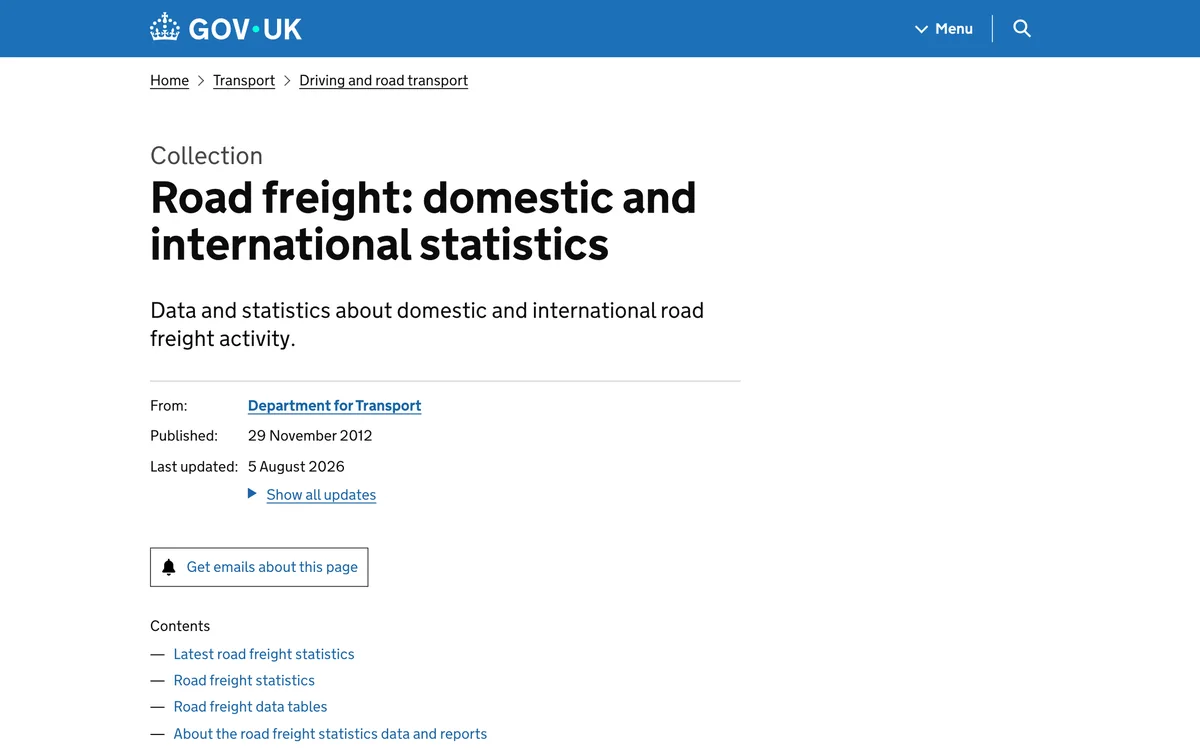
The Department for Transport's collection covers the domestic and international activity of British and Northern Irish HGVs, collected through its road freight surveys. Domestic statistics for April 2025 to March 2026 and the 2025 annual report are both labelled accredited official statistics.
Source: gov.uk
Rate, cost and capacity are different numbers
A rate index tracks what shippers pay against a base period, so 148 index points says nothing about the price of one lane. An operating cost series tracks what a haulier spends to run a vehicle.
A capacity ratio counts offers on one platform. A sentiment balance counts answers. A volume statistic counts tonnes.
They are linked, not interchangeable. IRU's reading that Q2 2026 rates rose on cost rather than demand comes from cost and volume series set beside the index. Cite the measure, not just the report.
A reporting citation checklist
Before citing a figure, note the series, publisher, edition, measure type, unit, geography and base period. For marketplace data, say whose users it covers. If it came through another report, name both.
Check reuse apart from access. Eurostat and the DfT allow reuse with acknowledgement. The gated reports grant no reuse licence, and IRU's page states all rights reserved, so quote with attribution and do not copy their tables or charts.
Where each method is published
| Series | Method source | Latest edition |
|---|---|---|
| Vektor market intelligence page | Source note on the page | Q1 2026 data, reviewed 18 July 2026 |
| Ti, Upply and IRU benchmark | Upply index methodology, PDF | Q2 2026 |
| TIMOCOM transport barometer | Description on the page | Live page, no edition date |
| Spain observatories | Introduction to each PDF | Costs July 2026; prices to Q2 2026 |
| BVL and ifo Logistik-Indikator | Method note, PDF | Q3 2026 commentary |
| Eurostat road freight | Notes under the charts | 2025 data, 24 September 2026 |
| DfT road freight statistics | Notes and definitions | Domestic, to March 2026 |
Indicator dictionary
One row per indicator you cite, filled from the publisher's own page and method note, not from a report that quotes it.
| Field | What to write | Your answer |
|---|---|---|
| Indicator and publisher | Series name and every co-publisher | |
| Measure type | Quoted price, rate index, offer ratio, operating cost, surveyed activity or sentiment | |
| Unit and base | Index points and base period, euros per km, tonnes or balance | |
| Geography | Countries, lanes or routes covered, and any excluded | |
| Sample or frame | Survey sample, platform users or modelled vehicle | |
| Cadence and edition | How often it updates and the edition you used | |
| History you can reach | Earliest open period; what is gated | |
| Reuse route | The licence or terms shown, or not stated | |
| What it cannot show | The claim it does not support | |
| Date read | The day you read the source |
Common questions
Is the Ti, Upply and IRU benchmark three sources?
No. It is one quarterly report published jointly, so cite it once and name all three publishers.
Can TIMOCOM's barometer tell me freight prices?
No. It is a ratio of freight offers to vehicle space offers in TIMOCOM's exchange. A rising share suggests tighter capacity, not a price rise.
Which series cover dangerous goods?
Eurostat publishes the dangerous goods share of road tonne kilometres, and Spain's cost observatory models chemical and LPG tankers. Upply's index method excludes dangerous goods.
Does Vektor publish its own rate index?
No. Our market intelligence page restates figures from the publishers it names. We have not built or measured an index.
Summary
Rates: the joint Ti, Upply and IRU benchmark. Capacity: TIMOCOM, read as a ratio. Costs and prices: Spain's observatories.
Sentiment: BVL and ifo. Volumes: Eurostat and the DfT. Name the measure whenever you cite one.
Sources
Downloads
More lists and references
About Vektor Research
Vektor Research is the reference side of Vektor Group, a road freight broker in Tallinn that arranges ADR and chemical transport. The research pages are free to read and to reuse under CC BY 4.0, and they carry no offer.
Rene Siller is responsible for the content; how the pages are built is set out in the methodology, and errors are corrected in the open. Editorial questions and error reports go to info@vektorgroup.eu.
No entry paid to be listed and no link carries an affiliate code.
Cite this list
Vektor Research. Road Freight Market Reports: 7 Compared by What Each Measures (2026). Vektor Group, 8 October 2026. https://vektorgroup.eu/resources/logistics/road-freight-market-reports