
Logistics marketing statistics are scarce, and many travel without their population or date. The open buyer survey behind many claims asked 100 logistics buyers in 2022, and 77% preferred a first contact by email (Logistics Marketing Advisors, Jun 2022). Most budget benchmarks are general B2B averages instead, such as the 7.02% of revenue that B2B product firms spent on marketing in the January 2026 CMO Survey (The CMO Survey, Mar 2026).
This page maps each source to its data period, population, metric and access limits, then gives the figures that hold up on budgets, channels, buyer contact, pipeline efficiency, search, AI and email. Every figure links to the organisation that measured it, and general B2B figures are marked as proxies.
Key Takeaways
- 77% of 100 logistics buyers surveyed in 2022 preferred a first contact by email (Logistics Marketing Advisors, Jun 2022).
- Only 6% of those buyers preferred a phone call, and none chose social media (Logistics Marketing Advisors, Jun 2022).
- A colleague's recommendation prompted 23% of buyers' last approach to a new logistics provider (Logistics Marketing Advisors, Jun 2022).
- Internet search prompted 10% of those approaches in 2022, down from 15% in 2020 (Logistics Marketing Advisors, Jun 2022).
- 76% of 108 supply chain marketers planned to invest in email marketing for 2024 (Virago Marketing, Jan 2024).
- More than 65% of those supply chain marketers use a marketing agency in some capacity (Virago Marketing, Jan 2024).
- General B2B proxy: B2B product firms put marketing at 7.02% of revenue in the January 2026 CMO Survey (The CMO Survey, Mar 2026).
- The CMO Survey's transportation figure of 3.83% of revenue rests on three companies (The CMO Survey, Mar 2026).
- LeadCoverage's median pipeline per dollar fell from $26.68 in Q3 2025 to $4.95 in Q4 2025 (LeadCoverage, Jun 2026).
- LeadCoverage's median qualified pipeline per go-to-market dollar rose to $22.39 in Q1 2026 (LeadCoverage, Jun 2026).
- 43% of 28 freight and logistics companies grew organic engaged sessions from Q1 2025 to Q1 2026 (LeadCoverage, Apr 2026).
- The 1,615% AI referral growth figure describes one TMS provider, rising from 13 to 223 sessions (LeadCoverage, Apr 2026).
- Industrial and commercial search advertisers paid a median $75.19 per lead in 2026 benchmarks (LocaliQ, Jun 2026).
- Mailchimp's public email benchmarks reflect December 2023 data and include no logistics category (Mailchimp, Dec 2023).
- 82% of links AI tools cited in late 2025 were earned media, and under 25% journalism (Muck Rack, Dec 2025).
Which logistics marketing statistics can be cited?
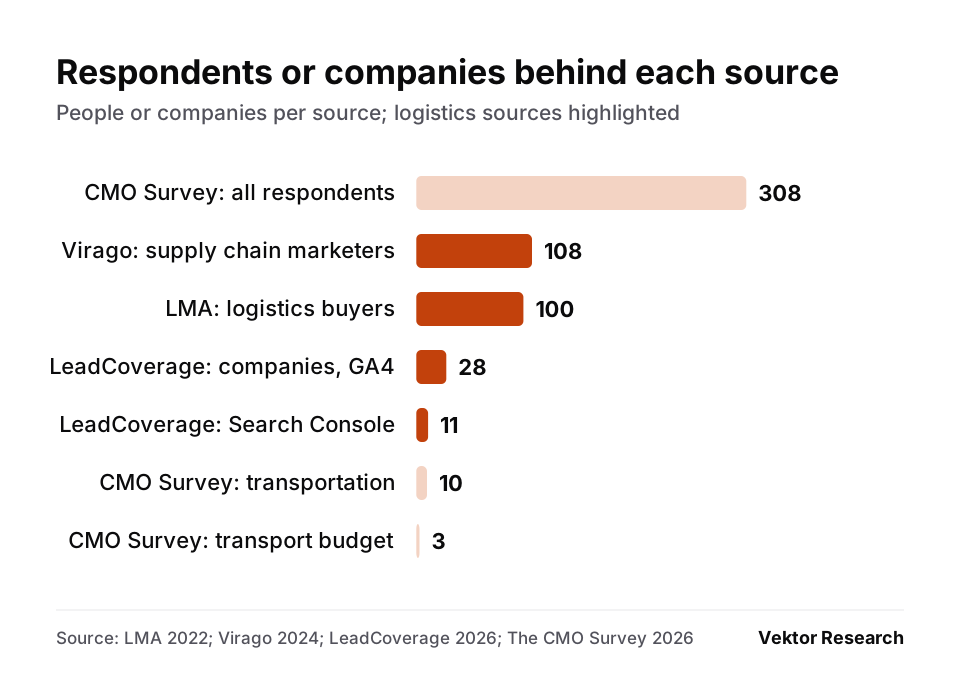
Only a few open sources measure logistics marketing directly, and each covers a different population, period and metric. Match a claim to its source before quoting it, because a buyer survey, a marketer survey and a vendor index answer different questions.
Which sources measure logistics companies or buyers directly?
Four publishers measure logistics marketing with a stated scope. Three are marketing agencies reporting their own surveys or client data, and one is a trade association whose report is for members.
| Claim or question | Source | Data period | Population | Metric and denominator | Access | Permitted interpretation | Limitation |
|---|---|---|---|---|---|---|---|
| How buyers want first contact; what prompted an approach to a new provider | Logistics Marketing Advisors, 2022 buyer report | 2022 survey, published June 2022; biennial since 2014 | 100 logistics buyers, almost all director level or above | Share of respondents choosing each answer | Open PDF | What senior logistics buyers said in 2022 | Four years old; self reported; no country split published |
| Marketing budgets, planned tactics, agency use | Virago Marketing, 2024 Outlook and Trends | Survey run in 2023, published January 2024 | 108 supply chain marketers, mostly at technology vendors | Share of respondents; budgets in dollar bands | Open page and PDF | What supply chain marketers planned for 2024 | Plans, not actual spend; respondents per revenue band not published |
| Qualified pipeline per go-to-market dollar | LeadCoverage, Supply Chain Growth Index | Quarterly, Q3 2025 to Q1 2026 | Freight tech, 3PLs, brokers and logistics providers; company count not published | Pipeline in US$ divided by go-to-market spend in US$; median and mean | Releases open; full index behind a download form | Direction within LeadCoverage's tracked cohort | Vendor data; cohort size unknown; Q4 2025 median restated |
| Organic, direct and AI referral traffic | LeadCoverage, State of Analytics in 2026 | Q1 2025 against Q1 2026, published April 2026 | GA4 data from 28 companies; Search Console data from 11 clients | Share of companies; sessions | Release open | A pattern within one agency's client data | Client sample, not a market average |
| Sales and marketing budgets, staffing and decisions | TMSA, 2026 Benchmarking Study | 2026 study | Not published | Not published | Full report for TMSA members | That the study exists and what it covers | No public figures |
- Logistics Marketing Advisors surveyed 100 logistics buyers in 2022, almost all at director level or above in logistics, supply chain and operations (Logistics Marketing Advisors, Jun 2022).
- Virago Marketing's 2024 report rests on 108 supply chain marketers across technology providers, 3PLs, carriers and shippers (Virago Marketing, Jan 2024).
- Almost 80% of Virago's respondents worked at companies with 1 to 499 employees, and most came from supply chain technology firms (Virago Marketing, Jan 2024).
- LeadCoverage's State of Analytics compared Q1 2025 with Q1 2026 across 28 companies and nearly one million organic website sessions (LeadCoverage, Apr 2026).
Which figures are general B2B proxies?
Budget shares, search ad costs, email rates and AI citation shares quoted for logistics usually come from studies covering many industries. They give context when labelled as proxies, never a logistics average.
| Claim or question | Source | Data period | Population | Metric and denominator | Access | Permitted interpretation | Limitation |
|---|---|---|---|---|---|---|---|
| Marketing spend as a share of revenue | The CMO Survey, 2026 Topline Report | Fielded 7 to 29 January 2026 | 308 US marketing leaders, 97% VP level or above; 10 in transportation | Mean % of revenue among those answering | Open PDFs | B2B context for budget planning | US only; three transportation answers on budget |
| Search ad cost per click, cost per lead, conversion rate | LocaliQ, 2026 Search Advertising Benchmarks | 1 April 2025 to 31 March 2026 | 13,474 US search campaigns in 23 categories | Median per category | Open article; full report behind a form | A range for business and industrial advertisers | No logistics category; LocaliQ and WordStream customers only |
| Email open, click and unsubscribe rates | Mailchimp, Email Marketing Benchmarks | Data as of December 2023 | Mailchimp campaigns sent to 1,000 or more subscribers, by user reported industry | Average rate per campaign | Open table; fuller report behind a form | Context for permission based email | No logistics row; open rates affected by Apple Mail Privacy Protection; not cold outreach |
| Share of AI citations by source type | Muck Rack, What Is AI Reading? | Prompts run July to December 2025 | More than one million links cited by ChatGPT, Claude, Gemini and Perplexity, many industries | Share of cited links | Open PDF | How AI answers cite sources across industries | Not logistics; models change their citation habits |
| Marketing budget as a share of revenue by company size | Fuse, logistics budget benchmarks | Not stated | Agency experience plus adjacent B2B benchmarks; no sample | Ranges of % of revenue | Open page | One agency's planning range | Not measured; no population |
- The 2026 CMO Survey drew 308 responses from 2,111 US marketing leaders, a 14.6% response rate, fielded 7 to 29 January 2026 (The CMO Survey, Mar 2026).
- Ten of the CMO Survey's 304 classified respondents were transportation companies, 3.3% of the sample (The CMO Survey, Mar 2026).
- WordStream's 2026 search benchmarks cover 13,474 US campaigns that ran from 1 April 2025 to 31 March 2026, reported as medians (WordStream, Sep 2026).
- Mailchimp's public benchmark table counts only campaigns sent to at least 1,000 subscribers, with data last updated in December 2023 (Mailchimp, Dec 2023).
- Muck Rack classified more than one million links cited by ChatGPT, Claude, Gemini and Perplexity between July and December 2025 (Muck Rack, Dec 2025).
What can be cited from a gated report?
Only what its publisher has released publicly. A landing page supports the fact that a study exists and what it covers, not figures from inside it.
- TMSA says its Sales and Marketing Benchmarking Study is published bi-annually and that the full 2026 report is a member benefit (TMSA, Sep 2026).
- LeadCoverage releases headline Supply Chain Growth Index figures in press releases and directs readers to its index page for the full report (LeadCoverage, Jun 2026).
- NTT DATA's page for the 2027 Third Party Logistics Study, dated 6 October 2026, lists qualitative takeaways and no figures (NTT DATA, Oct 2026).
- Mailchimp's public table shows four industries and an all users row, with a fuller report offered through a request form (Mailchimp, Dec 2023).
How much do logistics companies spend on marketing?
No open logistics study publishes marketing spend as a share of revenue with a usable sample. Supply chain marketers report budgets in dollar bands, and the share of revenue figures quoted for logistics come from general B2B surveys or agency estimates.
What marketing budgets do supply chain marketers report?
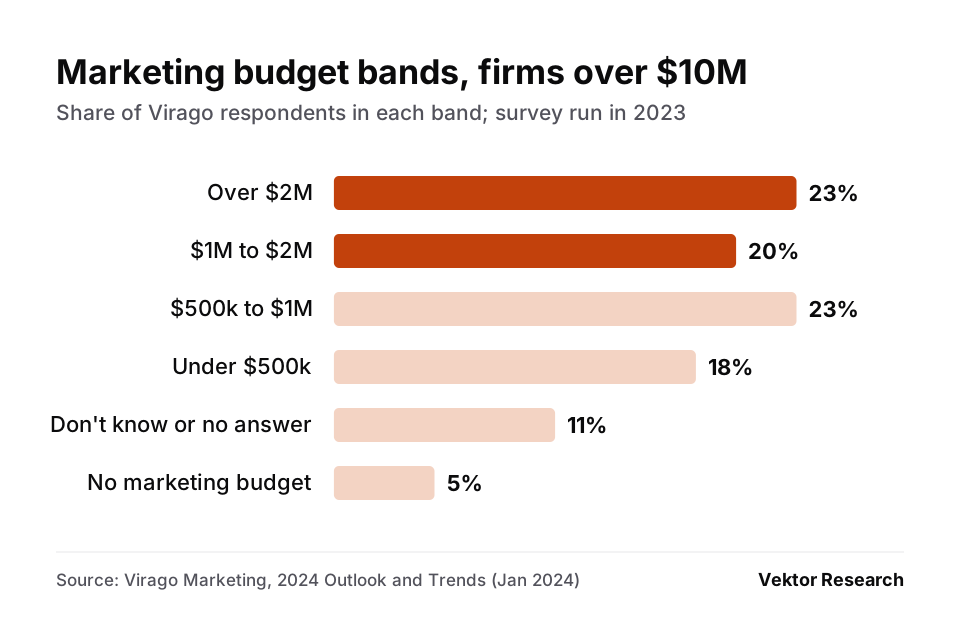
Budgets follow company size closely, and many smaller firms have no dedicated marketing budget at all.
- Most of Virago's respondents from firms with under 100 employees reported marketing budgets under $500,000 (Virago Marketing, Jan 2024).
- Almost a third of companies in Virago's 2023 survey reported no dedicated marketing budget (Virago Marketing, Jan 2024).
- Among respondents from companies with more than $10 million in revenue, 23% reported marketing budgets over $2 million and 20% between $1 million and $2 million (Virago Marketing, Jan 2024).
- In the $1 million to $5 million revenue band, 55% reported budgets under $500,000 and 18% had no marketing budget (Virago Marketing, Jan 2024).
- In the $5 million to $10 million revenue band, 40% reported no marketing budget and 30% a budget under $500,000 (Virago Marketing, Jan 2024).
- Virago publishes the shares for each revenue band without the number of respondents in each band (Virago Marketing, Jan 2024).
What share of revenue do B2B companies spend on marketing in 2026?
As a general B2B proxy, US marketing leaders report about 7% to 10% of revenue depending on business model. The transportation cut is too small to use.
- Marketing expenses averaged 8.96% of company revenue across 154 respondents to the January 2026 CMO Survey (The CMO Survey, Mar 2026).
- B2B product companies reported 7.02% of revenue from 61 answers and B2B services companies 10.07% from 41 answers (The CMO Survey, Mar 2026).
- The transportation sector mean of 3.83% of revenue comes from three answers, against 33 for technology, software and platform companies (The CMO Survey, Mar 2026).
- Companies with revenue under $10 million reported 13.34% of revenue on marketing, against 5.86% for companies with $100 million to $499 million (The CMO Survey, Mar 2026).
- Fuse, a marketing agency working in logistics and supply chain, suggests 8% to 15% of revenue for logistics firms under $5 million in revenue, a planning range with no survey behind it (Fuse, Jan 2025).
How do supply chain marketers use agencies?
Most use one for part of the work, and most planned to keep or increase that support for 2024.
- More than 65% of supply chain marketers in Virago's survey use a marketing agency in some capacity (Virago Marketing, Jan 2024).
- Over 45% use agencies for project work, 21% treat one as a critical part of their marketing, and a third work without agency support (Virago Marketing, Jan 2024).
- 62% planned to keep agency support at the same level and 25% planned to use agencies more (Virago Marketing, Jan 2024).
- 73.1% want an agency that understands their business (Virago Marketing, Jan 2024).
Which channels do logistics marketers fund and logistics buyers answer?
Most marketers planned to fund email, written content and SEO, and buyers' stated preferences point the same way. In the buyer survey, email was the preferred first contact and colleague recommendations prompted the most approaches.
Which tactics did supply chain marketers plan to fund for 2024?
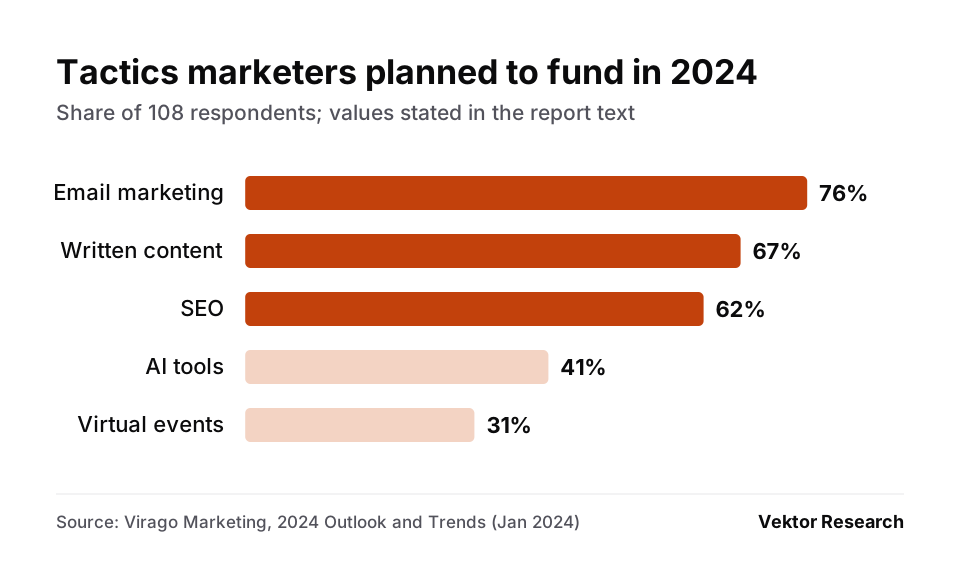
Email, written content and SEO each drew a majority, while the share planning to invest in AI tools nearly quadrupled from the previous survey.
- 76% of supply chain marketers planned to invest in email marketing, 67% in written content and 62% in SEO (Virago Marketing, Jan 2024).
- Planned investment in AI tools rose to 41% of respondents from 11% in the previous survey (Virago Marketing, Jan 2024).
- Planned investment in virtual events rose to 31% from 23% in 2022 (Virago Marketing, Jan 2024).
- Demonstrated ROI as a main metric rose from 12% to 25% of respondents against Virago's Q4 2022 survey (Virago Marketing, Jan 2024).
- The share not measuring marketing results at all fell from 8% to 5% (Virago Marketing, Jan 2024).
- 25% reported full integration of sales and marketing and 52% reported alignment, while 8% still work in separate silos (Virago Marketing, Jan 2024).
How do logistics buyers want to be contacted?
By email, by a wide margin. Phone and social media barely registered as a preferred first contact in 2022.
- 77% of logistics buyers preferred to be contacted by email, 14% through useful online content and 6% by phone call (Logistics Marketing Advisors, Jun 2022).
- 2% preferred a face to face meeting, 1% direct mail and none social media (Logistics Marketing Advisors, Jun 2022).
- 55% agreed that logistics salespeople they do not know should never call them (Logistics Marketing Advisors, Jun 2022).
- 36% agreed that they never respond to an email sales pitch from a logistics company, and 64% disagreed (Logistics Marketing Advisors, Jun 2022).
- 78% said they log into LinkedIn at least once a week (Logistics Marketing Advisors, Jun 2022).
- 74% said they do not mind giving their contact details to download useful content (Logistics Marketing Advisors, Jun 2022).
How shippers build shortlists and judge trust is covered in how shippers choose logistics providers.
What led logistics buyers to approach a new provider?
Recommendations and reputation, far more than search or advertising. Reputation nearly doubled as a trigger between 2020 and 2022, while search results fell back.
- A colleague's recommendation prompted 23% of buyers' last approach to a logistics business that was not a current supplier, down from 27% in 2020 (Logistics Marketing Advisors, Jun 2022).
- A strong reputation for the service needed prompted 21% of approaches, up from 11% in 2020 (Logistics Marketing Advisors, Jun 2022).
- An internet search result prompted 10% of approaches, down from 15% in 2020 (Logistics Marketing Advisors, Jun 2022).
- Useful content the company shared regularly prompted 9% of approaches, up from 5% (Logistics Marketing Advisors, Jun 2022).
- Trade show meetings prompted 7%, down from 11%, and advertising prompted none, down from 2% (Logistics Marketing Advisors, Jun 2022).
- 29% of logistics buyers relied on print magazines to stay current in 2022, against 70% in 2014 (Logistics Marketing Advisors, Jun 2022).
Newer shipper studies on discovery and selection are gathered in how shippers choose logistics providers.
How efficient is logistics go-to-market spending?
One public series measures it, LeadCoverage's Supply Chain Growth Index, and its median has swung sharply from quarter to quarter. Read it as one agency's tracked cohort, not an industry rate.
What does the Logistics Growth Efficiency Ratio measure?
Dollars of qualified pipeline created for each dollar of go-to-market spend, as LeadCoverage defines and collects them.
- LeadCoverage defines the LGER as dollars of qualified pipeline created per dollar of total go-to-market spend (LeadCoverage, Jun 2026).
- The index tracks freight, logistics and freight tech companies, and the releases do not state how many (LeadCoverage, Mar 2026).
- LeadCoverage launched the index as a quarterly benchmark in November 2025 (LeadCoverage, Nov 2025).
Measuring enquiry to booking in your own records is covered in freight RFQ metrics.
How did the median change between Q3 2025 and Q1 2026?
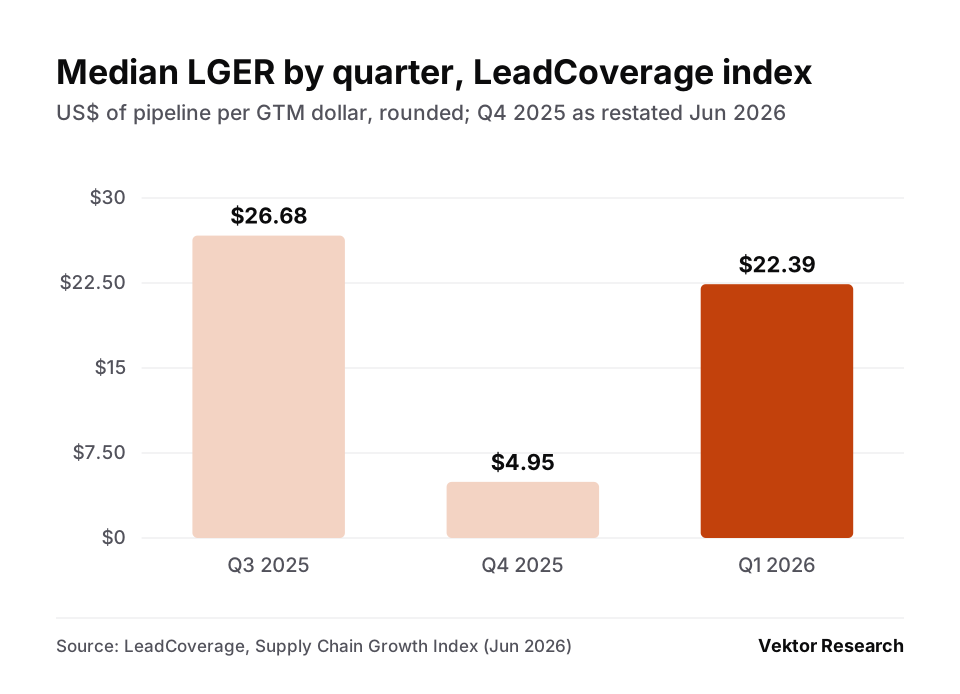
It fell by more than four fifths in Q4 2025, then recovered to about four and a half times that level in Q1 2026. Since Q4 the mean has sat far above the median, so a few large programmes carry the averages.
- The inaugural index for Q3 2025 recorded a median LGER of $26.68 and a mean of $29.51 (LeadCoverage, Mar 2026).
- The Q4 2025 median was first published as $4.84 against a mean of $25.74, with results from $0.36 to $204.30 (LeadCoverage, Mar 2026).
- Nearly half of tracked companies were below $3 of pipeline per dollar in Q4 2025 (LeadCoverage, Mar 2026).
- The Q1 2026 median reached $22.39 and the mean $100.97, which LeadCoverage reported as rises of 453% and 355% (LeadCoverage, Jun 2026).
- LeadCoverage reported the 25th percentile up 558% and the 75th percentile up 272% from Q4 2025 to Q1 2026 (LeadCoverage, Jun 2026).
- The release's own median values, $4.95 and $22.39, give a rise of about 352%, while 453% is close to Q1 expressed as a percentage of Q4, so quote the dollar values rather than the percentage changes (LeadCoverage, Jun 2026).
What did higher LGER programmes have in common?
LeadCoverage links them to sustained programmes rather than any single channel. These traits are its own observations, not proven causes.
- For Q4 2025, LeadCoverage said its upper quartile shared sustained ABM, intent data adoption and close marketing and sales alignment (LeadCoverage, Mar 2026).
- For Q1 2026, it named industry benchmark participation, consistent earned media and PR, and sustained SEO and AEO investment (LeadCoverage, Jun 2026).
- LeadCoverage attributes lower readings from new programmes to incomplete attribution tracking and limited programme maturity (LeadCoverage, Jun 2026).
How are search and AI changing logistics website traffic?
In one agency's client data, logistics sites ranked higher in Google while clicks fell, and fewer than half the companies grew engaged organic visits. AI referrals were still only 1% to 3% of organic volume.
Is organic search still growing for freight and logistics companies?
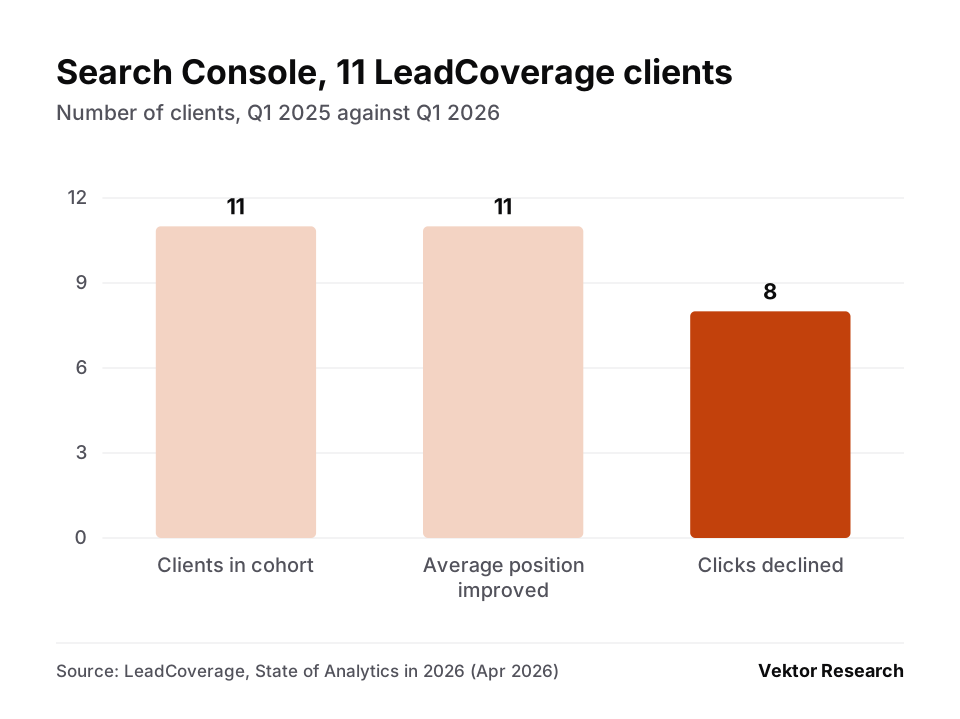
For a minority of them. Rankings improved for every client with Search Console data, while clicks fell for most.
- 43% of 28 freight and logistics companies grew organic engaged sessions between Q1 2025 and Q1 2026 (LeadCoverage, Apr 2026).
- Average Google ranking position improved for all 11 LeadCoverage clients with Search Console data, while clicks declined for eight of them (LeadCoverage, Apr 2026).
- More than 70% of LeadCoverage's clients showed direct channel engagement rates below 40%, which the agency reads as a sign of invalid traffic (LeadCoverage, Apr 2026).
- During one quarter of weekly press releases, LeadCoverage reported its own search impressions up 83% while clicks from traditional Google search declined (LeadCoverage, Jul 2026).
How much traffic do AI assistants send to logistics websites?
Little so far, though the visits that do arrive engage well. ChatGPT sends most of it.
- AI referral traffic made up 1% to 3% of organic volume across LeadCoverage's measured clients in Q1 2026 (LeadCoverage, Apr 2026).
- ChatGPT accounted for 70% to 87% of AI driven sessions across clients with measurable AI referral data (LeadCoverage, Apr 2026).
- Engagement rates for AI referred sessions ranged from 60% to 75% across measured clients (LeadCoverage, Apr 2026).
Which sources do AI tools cite?
As a general B2B proxy across industries, AI tools mostly cite sources nobody paid for. Press releases are a small but growing share.
- About 94% of links cited by AI tools between July and December 2025 came from non paid media (Muck Rack, Dec 2025).
- 82% of cited links came from earned media, down from about 89% in July 2025 (Muck Rack, Dec 2025).
- Press releases on any site rose from 1.2% to about 6% of AI citations between July and December 2025 (Muck Rack, Dec 2025).
- The journalists PR teams pitch most and those AI tools cite most for a brand overlap by only 2% on average (Muck Rack, Dec 2025).
- In a single company test of one press release a week for a quarter, AI tools cited LeadCoverage's data 1,058 times, about nine in ten through ChatGPT (LeadCoverage, Jul 2026).
Which paid search and email benchmarks apply to logistics?
None measures logistics directly. The closest search advertising categories are business services and industrial and commercial, and Mailchimp's public email table has no logistics row.
What do search ads cost business and industrial advertisers in 2026?
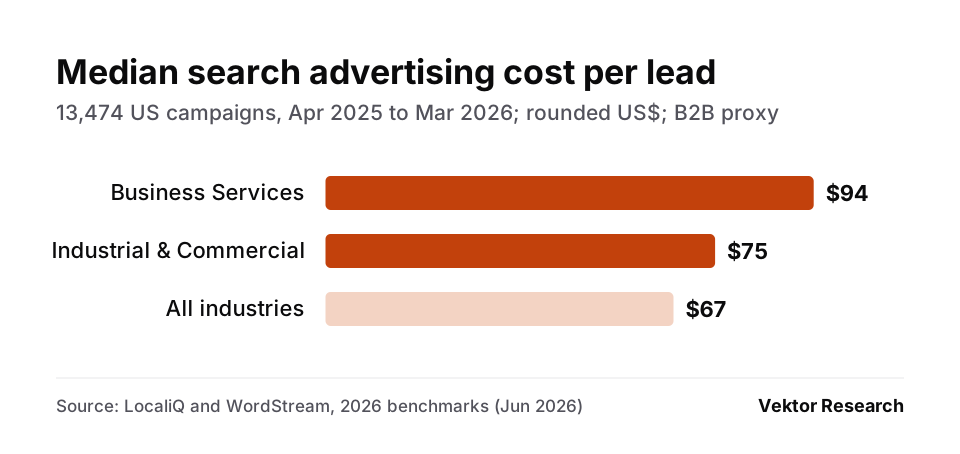
Click prices sit close to the all industry median. Business services pay more per lead, and fewer of their clicks convert.
- The median cost per click was $5.87 for both business services and industrial and commercial advertisers, against $5.42 across all industries (LocaliQ, Jun 2026).
- The median cost per lead was $93.69 for business services and $75.19 for industrial and commercial, against $66.69 across all industries (LocaliQ, Jun 2026).
- Median conversion rates were 4.85% for business services, 8.20% for industrial and commercial and 8.18% across all industries (LocaliQ, Jun 2026).
- Median click through rates were 6.10% for business services and 6.57% for industrial and commercial, against 6.64% overall (LocaliQ, Jun 2026).
- Each subcategory includes at least 52 active campaigns, and none of the 23 categories is logistics, freight or transport (WordStream, Sep 2026).
Which email benchmarks can a logistics marketer use?
Only general ones, for permission based campaigns. None covers cold outreach to shippers, and the public Mailchimp table reflects December 2023 data.
- Business and finance senders averaged a 31.35% open rate, a 2.78% click rate and a 0.15% unsubscribe rate (Mailchimp, Dec 2023).
- All Mailchimp users averaged a 35.63% open rate, a 2.62% click rate and a 0.22% unsubscribe rate (Mailchimp, Dec 2023).
- Mailchimp cautions that Apple Mail Privacy Protection may affect the accuracy of open rates (Mailchimp, Dec 2023).
- The same page's guidance gives an open rate of about 34.23% and a click rate of 2.66%, which differ from its own all users row (Mailchimp, Dec 2023).
- In the 2022 buyer survey, 36% of logistics buyers said they never respond to an email sales pitch from a logistics company (Logistics Marketing Advisors, Jun 2022).
Why do logistics marketing figures disagree?
Publishers restate their own numbers, define the same term differently and repeat each other's figures without the original population. Each case below changes what a writer can safely quote.
How did one company's traffic become a freight growth rate?
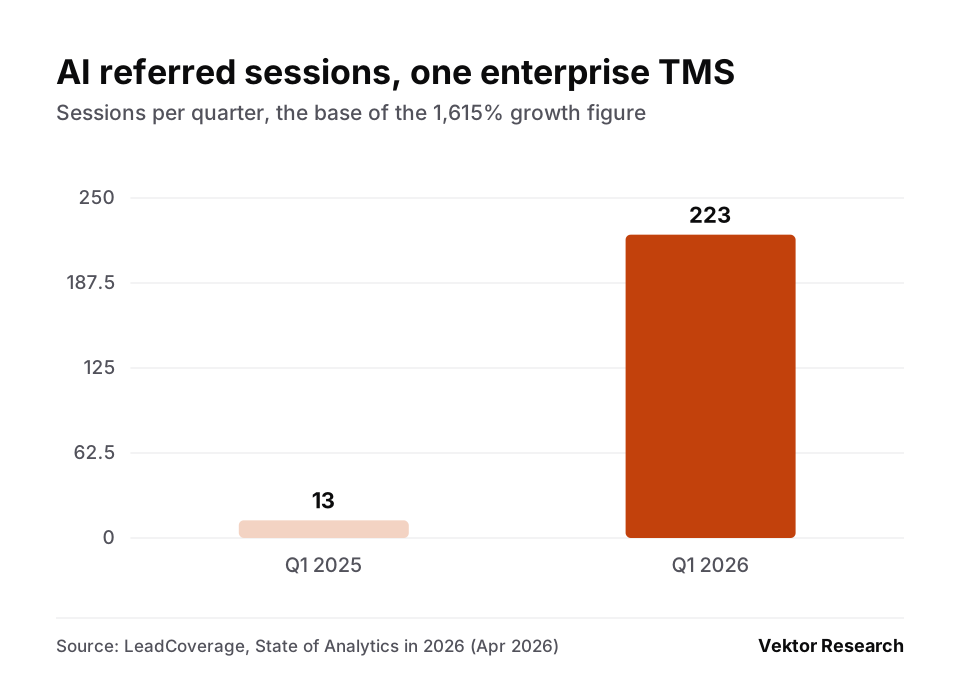
The 1,615% figure measured one enterprise TMS provider, then lost that qualifier in a later release. Small bases produce large percentages.
- One enterprise TMS provider's AI referred sessions rose from 13 in Q1 2025 to 223 in Q1 2026, the source of the 1,615% figure (LeadCoverage, Apr 2026).
- A May 2026 LeadCoverage release described it as referral traffic from tools like ChatGPT increasing 1,615%, without naming the single company base (LeadCoverage, May 2026).
- Across the same clients, AI referrals were still 1% to 3% of organic volume (LeadCoverage, Apr 2026).
Is earned media 25%, 82% or 90% of AI citations?
It depends on the definition, and only the original study states one. Journalism alone was just under a quarter of cited links, while Muck Rack's wider earned media category reached 82%.
- Muck Rack counted 82% of AI cited links as earned media and just under 25% as journalistic sources (Muck Rack, Dec 2025).
- A March 2026 LeadCoverage release summarised the same study as journalistic and earned media sources accounting for nearly 25% of citations (LeadCoverage, Mar 2026).
- An April 2026 LeadCoverage release said 90% of the citations driving brand visibility in LLMs come from earned media (LeadCoverage, Apr 2026).
How should these figures be cited?
Quote the population, the data period and the publisher together, and link the original study rather than a summary of it. Use the publication month for the citation date, state the fieldwork period in the sentence, and mark cross industry figures as general B2B proxies.
When a publisher restates a figure, cite the later release and note the earlier value. For a gated report, cite only what the publisher released publicly and say that the full report is gated.
- LeadCoverage's June 2026 release gives the Q4 2025 median as $4.95, where its March 2026 release gave $4.84 (LeadCoverage, Jun 2026).
- Virago's 2024 report quoted the CMO Survey at 7.4% to 7.9% of revenue for B2B companies, an earlier edition than the 2026 figures on this page (Virago Marketing, Jan 2024).
- Logistics Marketing Advisors has run its buyer survey every two years since 2014, so a figure from the 2022 wave should be cited as 2022 data (Logistics Marketing Advisors, Jun 2022).
Methodology and Sources
Every figure comes from the organisation that measured it: marketing agencies reporting their own surveys or client data (Logistics Marketing Advisors, Virago Marketing, LeadCoverage), studies covering many industries used as general B2B proxies (The CMO Survey, LocaliQ and WordStream, Mailchimp, Muck Rack), and one agency estimate (Fuse). Citations carry the publication month, and each sentence states the data period, because fieldwork often runs months or years before publication. Provider results stay attributed to the provider and describe its own sample, not the market.
Reports from TMSA, NTT DATA, LeadCoverage and Mailchimp that sit behind a membership or form are described only from their public pages. No figure is taken from a statistics roundup, and the page is reviewed every six months and after each new TMSA, LeadCoverage or Logistics Marketing Advisors release.
Correction history: first published 8 October 2026, no corrections since.
Glossary
- Logistics Growth Efficiency Ratio (LGER): LeadCoverage's ratio of qualified pipeline created to go-to-market spend; its index page counts media, PR, technology, vendors and marketing headcount, and excludes sales labour.
- Go-to-market spend: money spent to win customers, as LeadCoverage defines it for the LGER.
- Qualified pipeline: the value of sales opportunities that meet a company's own qualification rules, which differ between firms.
- General B2B proxy: a figure measured across many industries, used for context where no logistics figure exists.
- Data period: the time a figure describes, such as a survey's fieldwork month.
- Publication date: when the source released the figure, often months after the data period.
- Organic engaged session: a visit from unpaid search that Google Analytics 4 counts as engaged under its own rules.
- AI referral session: a website visit that arrives from an AI assistant such as ChatGPT or Perplexity.
- Earned media: coverage a company neither pays for nor publishes itself; studies draw the line differently.
- Cost per lead: advertising spend divided by the number of leads, such as calls or form fills.
- Mail Privacy Protection: an Apple Mail feature that Mailchimp says can affect the accuracy of recorded open rates.
Sources
- Fuse: Logistics and Supply Chain Marketing Budget Benchmarks. Data period not stated; published January 2025. Agency estimate.
- LeadCoverage: Advice for Freight Providers, the First Five Minutes Now Decide the Deal. Published May 2026. Restates the State of Analytics figure.
- LeadCoverage: AI Referral Traffic in Freight Grew 1,615% as Bot Crisis Deepens (State of Analytics in 2026). Data Q1 2025 against Q1 2026; published April 2026. Client data.
- LeadCoverage: Analyst Relations as a Revenue Engine release. Published April 2026. Secondary synthesis.
- LeadCoverage: Data Led PR Programs Earn 3.5x More AI Citations. One quarter, dates not stated; published July 2026. One company.
- LeadCoverage: New Research Finds Earned Media Accounts for 25% of All LLM Citations. Published March 2026. Summary of the Muck Rack study.
- LeadCoverage: Q4 2025 Supply Chain Growth Index. Data Q3 and Q4 2025; published March 2026.
- LeadCoverage: Q1 2026 Supply Chain Growth Index. Data Q1 2026; published June 2026.
- LeadCoverage: Supply Chain Growth Index launch. Published November 2025.
- LeadCoverage: Supply Chain Growth Index methodology page. Undated; full index behind a form.
- LocaliQ: 2026 Search Advertising Benchmarks. Data April 2025 to March 2026; updated June 2026. General B2B proxy.
- Logistics Marketing Advisors: 2022 Logistics Buyer Research Report. Data 2022 survey; published June 2022.
- Mailchimp: Email Marketing Benchmarks. Data as of December 2023. General B2B proxy.
- Muck Rack: What Is AI Reading? December 2025. Data July to December 2025; published December 2025. General B2B proxy.
- NTT DATA: The 2027 Third Party Logistics Study. Published October 2026. Full report gated.
- The CMO Survey: Firm and Industry Breakout Report 2026. Data January 2026; published March 2026. General B2B proxy.
- The CMO Survey: Topline Report 2026. Data January 2026; published March 2026. General B2B proxy.
- TMSA: 2026 Benchmarking Study Webinar. 2026 study; full report for members only.
- Virago Marketing: 2024 Outlook and Trends, Supply Chain Marketing (full report). Data 2023 survey; published January 2024.
- Virago Marketing: 2024 Supply Chain Marketing Report page. Data 2023 survey; published January 2024.
- WordStream: 2026 Google Ads Benchmarks. Data April 2025 to March 2026; updated September 2026. General B2B proxy.